|
May 24, 2006
State of the States
Written by Jeff Thredgold, CSP, President, Thredgold Economic Associates
The current U.S. economic expansion, now well into its fifth year, has contributed to varying levels of performance among the 50 states. The simplistic comparison suggests that states in the West and the South are enjoying stronger performance, while those in the Northeast and the Midwest have seen less robust growth.
 States with significant natural resources, including oil, natural gas, and coal are doing well. States more dependent on manufacturing are struggling. States with significant natural resources, including oil, natural gas, and coal are doing well. States more dependent on manufacturing are struggling.
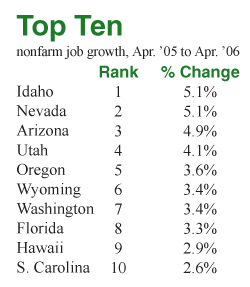
The Rocky Mountain region again leads the way in employment growth (see table). By comparison, much of the region was hit very hard by the recession of 2001, the horrific events of September 11, and the initially weak economic recovery.
Conversely, the nations industrial heartland of Michigan, Ohio, and parts of the Northeast finds itself in the bottom 10 states as measured by employment gains, accompanied by Louisiana & Mississippi (hurricane impact). The primary culprit in the industrial Midwest has been ongoing job cuts in the auto sector and various auto suppliers.
Real Estate Shift
Many states, particularly those on both coasts and in the Southwest, have benefited from strong residential and commercial real estate markets. However, we expect a shift to develop here.
Construction- and home finance-related employment strength and home price surges on both coasts and in the SW of the past few years are now expected to give way to relatively stronger performance in the nations interior. Residential and commercial real estate values in those areas have become so out-of-line with similar properties in the interior as to now draw significant dollars into communities such as Atlanta, Boise, Dallas, and Salt Lake City.
|
Buddy, Can You Spare a
Worker?
Extremely tight labor markets will contribute to some slowing in the high growth states over the next 18 months. It is very difficult to fill open positions in numerous markets around the nation, especially in the Rocky Mountain States.
Various employers, including many in the transportation sector, have publicized hundreds of open positions, with little, if any, response. Employers in various industries are paying signing bonuses for new hires or providing bonuses to current workers who bring in another potential employee.
|
|
|
Investors with bags of money have shifted their focus to markets with greater relative values, and are snapping up office buildings, raw land, multi-family properties, etc. Many communities are seeing major increases in outside investment dollars.
More Revenue
Solid U.S. economic performance has led to a majority of the states (more than 40 at last count) now running budget surpluses. Many states are dealing with the greatest surge in tax revenue ever recorded.
State and local tax collections rose 10.2% last year to a record $1.1 trillion, according to the Census Bureau (USA TODAY). Many states that suffered from serious budget challenges 2-4 years ago are now flush with new money.
State and local economic growth is clearly subject to fits and starts. A number of states are primarily spending excess funds, while others are returning much of the surplus to taxpayers.
Those states legislatures that choose to spend excess dollars, and commit taxpayers to higher spending in the future, may rue the day. States that cut income tax rates in times of excess typically have greater levels of job and income creation, versus those which ramp up current and future spending.

Moody Markets
Financial market players have experienced a wide range of emotions over the past two weeks, with stock prices moving lower. Bond prices, which fell somewhat last week, rose slightly in recent days as market psychology shifted a bit.
Good news for the stock market on May 16 was the release of the April Producer Price Index. While the headline number was up 0.9%, the core rate of inflation (excluding food and energy, which financial markets
and the Federal Reserve
are most concerned with) rose only a modest 0.1% for the second month in a row. The overall market perception was that higher energy costs impacting the headline PPI data were not being passed through when viewing the core data
that warm and fuzzy feeling lasted only 24 hours
The following days release of the Consumer Price Index for April told a different story. The headline number showed a rise of 0.6%, slightly above market expectations. However, the core rate (again when excluding food and energy prices) jumped 0.3% for the second consecutive month
the sick feeling that prices across the board were being impacted by rising energy costs, which would require even more Federal Reserve attention (yes
even more tightening) soon led stock prices sharply lower. The market had its worst week in a very long time.
Bond prices also fell in response to the data, pushing intermediate- and long-term interest rates higher. The key 10-year U.S. Treasury Note, the most important in determining where 30-year fixed rate mortgages move, saw its yield rise to 5.15%, the highest in, yes
a very long time.
Different View
The drop in most commodity prices, including gold, silver, copper, etc. of the past 10 days has now led many bond market players to a slightly different conclusion. The sharp decline in commodity prices is somewhat a giveback for the excessive rise of the past 6-24 months.
|
It is worth repeating
the Fed does not know at this point whether it will tighten on June 29, or on August 8, or on September 20
|
|
The drop, however, is perhaps also tied to rising perception that the U.S. and global economies may be adversely impacted by the threat of even higher short-term interest rates around the world. As noted before, the Federal Reserve is perhaps within one or two 0.25% moves of concluding its monetary tightening program.
However, the European Central Bank seems on its way to further tightening moves, while the Bank of Japan will soon reverse its zero interest rate policy and begin to tighten modestly. Other central banks, including those in Canada, China, and Switzerland are also involved in pushing short-term rates higher to fight inflation pressures knocking at their doors.
Data Friday
Whether the Fed does indeed tighten for a 17th consecutive time on June 29, or whether it temporarily moves to the sidelines, will be greatly impacted by Fridays release of the Feds favorite inflation measure, the core personal consumption expenditures index (core PCE). The core PCE is already at the top of the Feds desired 1.0%-2.0% annual inflation band.
An uncomfortably high inflation read on Friday would likely set the stage for further Fed action on June 29. A more tolerable number would allow the Fed greater flexibility. It is worth repeating
the Fed does not know at this point whether it will tighten on June 29, or on August 8, or on September 20. The Fed is on record as being data dependent
stay tuned
Teasers
A word to the wise aint necessary. Its the stupid ones who need the advice.
Bill Cosby
I am a marvelous housekeeper. Every time I leave a man I keep his house.
Zsa Zsa Gabor
You can observe a lot by just watching.
Yogi Berra
|